
Motor Control Economics
VFD vs Soft Starter vs DOL — lifecycle cost, payback and load physics
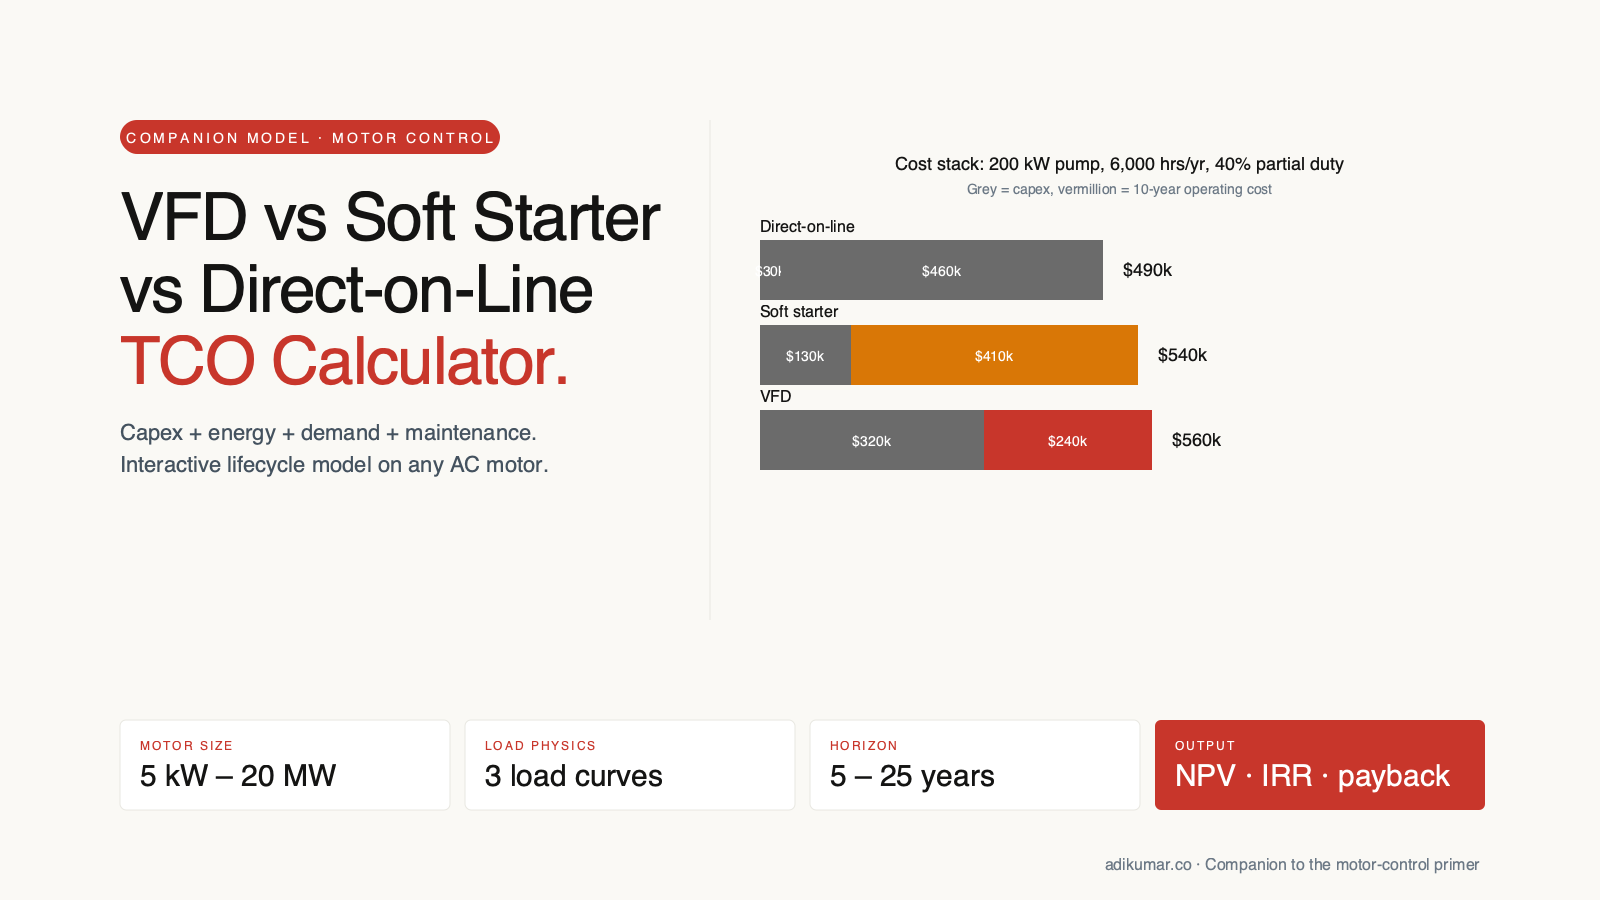
Interactive model comparing capex, annual energy cost and 10-year lifecycle NPV for the three basic starting options on any AC motor. Companion to the motor-control primer.
Motor and duty inputs
- Centrifugal (pumps, fans, blowers) — cubic affinity law; 70% speed cuts shaft power to about 34%.
- Constant torque (conveyors, screw compressors, extruders) — power scales linearly; 70% speed cuts shaft power to 70%.
- Constant power (traction, winders, machine spindles) — power is roughly invariant with speed; no VFD energy saving on this duty.
Advanced: DC-native architecture (bus voltage, breaker topology, AFE allocation)
Set inputs to see the result.
Why the result moves: waterfall from direct-on-line to lowest-cost option
Starting from the DOL / IE1 reference case, green bars are savings and red bars are premiums. The IE class bar moves when you change motor efficiency; the load-physics saving is the VFD affinity-law benefit; the final bar is the winner's 10-year total.
10-year cost stack (capex + energy)
Break-even and payback (vs direct-on-line baseline)
Direct-on-line
Soft starter
VFD
DC-fed inverter
Side-by-side scenario comparison
Winner column flagged in vermillion. DCI metrics reflect the DC bus voltage and breaker topology toggles above.
Cost of saved energy (vs direct-on-line)
Capex premium divided by cumulative electricity saved over the analysis period. Below the local energy price it is cheaper to save a kWh with this option than to buy one; above it is not.
What has to be true for the winner to win
Set inputs to see the conditions.
Why the result moves
n/a
Annual operating cost (energy + demand + maintenance)
| Option | Energy MWh/yr | Total OPEX/yr | Delta vs DOL |
|---|
Capex, NPV and IRR
| Option | Installed capex | Lifetime NPV | IRR of capex premium |
|---|
Cumulative cost over analysis period
Sensitivity: which inputs move the winner's NPV most
Each bar shows how the winner's 10-year NPV changes when the input moves ±30% around the current value. Wider bars matter more for the decision.
Payback heatmap: duty cycle × load type (VFD vs DOL)
Simple payback years for VFD vs DOL across duty-cycle-at-reduced-speed (columns) and partial-speed setpoint (rows) at the current motor and price settings. Green cells pay back inside the analysis period; red cells never do. Your current setting is highlighted.
Model assumptions
Directional analytical model. Read each category below; replace defaults with project-specific inputs before using for tender-level decisions.
Capex
- Mid-band $/kW figures from the primer's Exhibit 3 (equipment only)
- Illustrative installed-cost multipliers: 1.6× VFD (cabinet, transformer for MV, harmonic filter, install), 1.25× soft starter (bypass, MCC integration), 1.2× DOL (contactor, starter, protection)
- Actual balance-of-plant varies materially by voltage, motor size, harmonic requirements, bypass arrangement and site conditions; replace with project-specific BOP for tender work
Motor efficiency
- IE class (per IEC 60034-30-1) divides every option's shaft-side energy equally
- Motor efficiency matters, but at large motor ratings the incremental IE-class energy difference is generally smaller than the saving created by changing the operating point of a variable-speed load
- The delta between DOL / SS / VFD comes from the load-physics saving on partial-speed hours, not the motor class
- IEC class efficiency is recomputed from IEC 60034-30-1:2025 anchor tables based on the motor rating selected above. The 4-pole 50 Hz baseline is used; pole-count effects are not modelled explicitly.
- VFD conversion loss is modelled as an illustrative 2.5% stacked on top of motor loss (applies to the VFD path only). Actual drive efficiency varies with load, voltage class and topology; typical LV IGBT drives run 96 to 98% at rated load, MV CHB drives run 96 to 97% including the phase-shifting transformer. Soft-starter and DOL paths add no drive loss on top of the motor.
Load-physics scaling
- Affinity-law scaling (P ∝ N³) for centrifugal loads
- Approximately linear scaling as a user-selected assumption for other loads
- Constant-torque loads scale approximately linearly with speed; VFD energy savings are therefore materially smaller than on centrifugal (affinity-law) loads. Constant-power loads show no VFD energy saving.
- Base case assumes the remaining operating time is at rated speed
Demand charges
- Reflect the C&I tariff structure (kW × $/kW/month × 12) where a large portion of the bill runs on billing demand, with energy as a smaller component
- A VFD can reduce the motor's contribution to peak demand during partial-speed hours; soft starter and DOL do not materially change running demand
- Illustrative. Actual savings depend on the site's billing-demand interval and whether this motor contributes to the site peak
Maintenance (optional)
- Included only when the maintenance toggle is set
- VFD $8/kW-year. DC-bus capacitor and cooling fan overhaul at year 7, amortised
- Soft starter $2/kW-year. Bypass contactor cycling
- DOL $1/kW-year. Starter contactor
Excluded from the model
- Control-integration cost
- Harmonic-mitigation retrofits
- Cybersecurity compliance overhead (IEC 62443 / EU CRA programme cost)
- Vendor-specific pricing (list-band inputs only)