
The Investment Layer framework
How the AI buildout gets financed. Where the capital comes from, who deploys it, how it consolidates, and what breaks the underwriting when the thesis fails. The capital-allocation view of the buildout, alongside the AI Power Chain (physical stack) and the Due Diligence framework (underwriting execution). The operational tools: physical-asset scorecards, a sponsor-thesis stress-testing workbench, and a downside monitoring dashboard.
[P] Public evidence — disclosed in filings, press releases, or verified reporting. [D] Derived analysis — framework-applied inference from public inputs. [I] Illustrative assumption — chosen to demonstrate mechanics, not a claim about the target.
The framework in one paragraph
The Investment Layer covers the capital allocation pattern that emerged around AI infrastructure buildout from 2023 through 2026. Six distinct pools of capital finance the buildout at different scale, on different return profiles, and against different collateral bases. Five distinct PE playbooks operate across the six physical Power Chain layers, each with a different exit path. Four M&A through-lines describe the vendor consolidation pattern of 2023-2026. Three downside scenarios stress the underwriting thesis. One structural pattern, the build-to-lease flip, has reshaped hyperscaler asset ownership over the past seven years. The framework treats those five decompositions as the analytical machinery required to price AI infrastructure exposure at asset, sponsor, or portfolio level.
The framework operationalised
The framework runs as three connected components. First, physical-asset assessment lives at the AI Power Chain framework and its two tools: the 10-minute Power Chain scorecard for screening and the 25-minute Power Chain workbench for professional DD. Second, sponsor-thesis stress-testing runs through this framework's two tools: the 15-minute Investment Layer scorecard and the 35-minute Investment Layer workbench. Third, dynamic monitoring runs post-close via the sponsor signal dashboard (5 primary + 5 secondary + up to 4 sponsor-specific signals, each with owner, threshold, and defined trigger action).
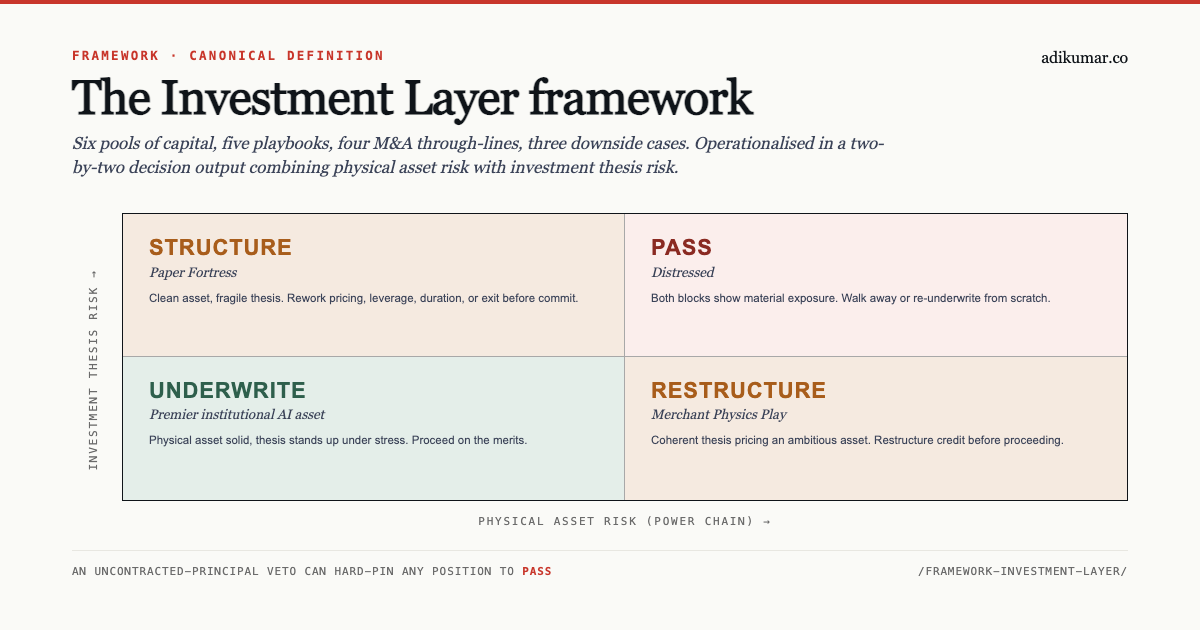
The two scorecards share a cross-framework two-by-two output: physical asset risk on one axis, investment thesis risk on the other. Four IC-standard decisions surface: UNDERWRITE, STRUCTURE, RESTRUCTURE, and PASS. The dangerous quadrant is the top-left one that a linear composite score would hide, a clean asset carrying a fragile thesis. A veto flag on either scorecard hard-pins the combined output to PASS regardless of section scores or plotted position.
Why the framework exists
Classical infrastructure investing frameworks (regulated utility, contracted midstream, PPP, project-financed asset) do not map cleanly onto AI infrastructure exposure. Venture and growth-equity frameworks do not map cleanly either. The AI buildout of 2023-2026 has produced capital structures, sponsor economics, and covenant packages that borrow selectively from each of those traditions without fitting any of them.
Standard sell-side coverage has trailed the buildout by roughly 18 months, treating AI data centre operators as regulated-utility-adjacent, and treating hyperscaler capex as a cyclical infrastructure line. Both readings miss the specific mechanics that shape recovery risk under stress. When Blackstone acquired QTS in 2021 in a transaction reported at approximately US$10B per public disclosures, the underwriting was priced against a pre-AI colocation growth curve. When KKR and Global Infrastructure Partners took CyrusOne private in 2022 in a transaction reported at approximately US$15B per company disclosures, the same. When Blackstone with Canada Pension Plan Investment Board acquired AirTrunk in September 2024 for approximately US$16B per company disclosures, the underwriting had started to price the AI transition but still not the specific supply-chain and thermal constraints that decide operator margins at 100+ kW per rack.
The Investment Layer framework exists to close that gap. It was developed for internal use during commercial due diligence work on AI infrastructure targets in 2024-2025, then codified across the eight-essay Investment Layer series in 2026. The framework composes with the AI Power Chain framework (physical infrastructure decomposition), the Due Diligence framework (operational underwriting process), and the Financing the AI Buildout series (specific capital structures).
The six pools of capital
Pool 1. Hyperscaler cash flow
Microsoft, Meta, Google and Amazon have self-funded the majority of the AI infrastructure buildout through 2024 from operating cash flow. Estimates for aggregate hyperscaler capex on AI infrastructure over 2025-2028 sit around $500B-700B depending on which programmes are included in the count. This pool has a cost-of-capital advantage that no third-party sponsor can match. The constraint on hyperscaler self-development shows up in management attention and internal engineering capacity for gigawatt-scale execution on a two-year cycle. Cost of capital already stands at levels no third-party sponsor can match, so bandwidth to execute binds sooner than capital availability does.
Where it deploys
Concentrated in greenfield AI training capacity where the site is strategic, the design is proprietary, or the technology is at the frontier. Meta's Louisiana campus, Microsoft's Wisconsin build, Google's SMR partnerships, Amazon's Susquehanna adjacency all sit in this category. Hyperscalers lease the balance of their footprint from third-party developers.
Framework calibrated on live deals
Three case studies apply the framework end-to-end on 2024-2026 transactions. Each includes per-layer scoring, the 2×2 verdict visual, and the assessment basis for public [P], derived [D], and illustrative [I] claims.
- AirTrunk / Blackstone + CPP (Sep 2024) — UNDERWRITE benchmark. Both scores LOW, veto GREEN. The clean-deal calibration anchor.
- CoreWeave $2.6bn DDTL 3.0 (Jul 2025) — AMBER worked example. Parent-guarantee absorbs an open tail that would fire the veto in a thin-equity SPV. Framework verdict: RESTRUCTURE with AMBER, not RED.
- Crusoe / Stargate Abilene — RESTRUCTURE, realized. Framework flagged single-tenant concentration pre-close; the failure mode materialised in Mar 2026 when Oracle + OpenAI dropped the expansion. Microsoft + Meta stepped in.
Related work
Pool 2. Structured debt (DDTL)
Delayed-draw term loan structures collateralised against specific hyperscaler contract commitments have become the primary debt instrument financing the specialist GPU cloud operators. CoreWeave has anchored the pool with facilities totalling roughly $35B by mid-2026 per Q2 2026 investor disclosures, split between recourse (~$31.4B) and non-recourse (~$3.7B) capacity. Nscale and Crusoe are scaling with similar structures. Aggregate committed DDTL capacity across the specialist GPU cloud vendors sits around $95B by mid-2026.
Structural characteristics
DDTL sits closer to structured credit than to corporate revolver. Recovery risk under stress runs to the counterparty credit of the specific hyperscaler or GPU-cloud offtake pledged against each facility, rather than to the operator itself. Individual DDTLs disclose different counterparty exposure: CoreWeave's DDTL 3.0 supports a specific long-term customer contract identified in July 2025 SEC disclosure, priced at SOFR+400 with a 0.50% undrawn commitment fee, parent-guaranteed, unrated at the DDTL 3.0 level (Ba2/BB+ ratings apply to the subsequent DDTL 5.5 facility). Rating agencies have not settled on a standard framework for the category; ratings assigned by S&P, Moody's and Fitch on 2024-2026 vintage DDTLs have varied meaningfully across nominally comparable collateral packages.
Framework calibrated on live deals
Three case studies apply the framework end-to-end on 2024-2026 transactions. Each includes per-layer scoring, the 2×2 verdict visual, and the assessment basis for public [P], derived [D], and illustrative [I] claims.
- AirTrunk / Blackstone + CPP (Sep 2024) — UNDERWRITE benchmark. Both scores LOW, veto GREEN. The clean-deal calibration anchor.
- CoreWeave $2.6bn DDTL 3.0 (Jul 2025) — AMBER worked example. Parent-guarantee absorbs an open tail that would fire the veto in a thin-equity SPV. Framework verdict: RESTRUCTURE with AMBER, not RED.
- Crusoe / Stargate Abilene — RESTRUCTURE, realized. Framework flagged single-tenant concentration pre-close; the failure mode materialised in Mar 2026 when Oracle + OpenAI dropped the expansion. Microsoft + Meta stepped in.
Related work
Pool 3. Private equity growth and buyout
Sponsor deployment across the AI infrastructure map has followed five recognisable playbooks, which vary by which physical Power Chain layer the target occupies. Blackstone acquired QTS in 2021 (approximately US$10B per public disclosures) at the developer layer. KKR + Global Infrastructure Partners took CyrusOne private in 2022 (approximately US$15B per public disclosures) at the same layer. Blackstone with CPP Investment Board acquired AirTrunk in September 2024 for approximately US$16B per company disclosures. Vendor-layer sponsors take industrial-technology positions with AI infrastructure exposure without direct data centre ownership. Bain Capital-led consortium took Hitachi Metals private (agreement April 2021; tender offer completed 25 October 2022; aggregate ~$7.5B; rebranded Proterial January 2023), taking a position in the AMB silicon-nitride substrate supply feeding wide-bandgap semiconductor packaging. KKR previously owned CoolIT before selling to Ecolab (closed 2 July 2026, ~$4.75B), capturing a full direct-to-chip cooling growth cycle.
Structural characteristics
Return profiles vary sharply by layer. Developer-layer sponsors underwrite to hyperscaler-contracted revenue and target IRRs in the mid-teens on 5-7 year hold. Vendor-layer sponsors underwrite to industrial-technology multiples and target IRRs in the high-teens to mid-twenties on 4-6 year hold. Behind-the-meter power sponsors underwrite to long-dated PPAs and target IRRs closer to core-infrastructure levels.
Framework calibrated on live deals
Three case studies apply the framework end-to-end on 2024-2026 transactions. Each includes per-layer scoring, the 2×2 verdict visual, and the assessment basis for public [P], derived [D], and illustrative [I] claims.
- AirTrunk / Blackstone + CPP (Sep 2024) — UNDERWRITE benchmark. Both scores LOW, veto GREEN. The clean-deal calibration anchor.
- CoreWeave $2.6bn DDTL 3.0 (Jul 2025) — AMBER worked example. Parent-guarantee absorbs an open tail that would fire the veto in a thin-equity SPV. Framework verdict: RESTRUCTURE with AMBER, not RED.
- Crusoe / Stargate Abilene — RESTRUCTURE, realized. Framework flagged single-tenant concentration pre-close; the failure mode materialised in Mar 2026 when Oracle + OpenAI dropped the expansion. Microsoft + Meta stepped in.
Related work
Pool 4. Sovereign capital
Sovereign wealth funds and state-adjacent capital have taken material positions across the AI infrastructure buildout at scale. Eight sovereign pools account for the majority of committed capital in this category: GAIIP (the Global AI Infrastructure Investment Partnership targeting $100B deployment by 2030 with a $30B initial anchor), PIF and its HUMAIN vehicle (approximately $30-40B international commitments per public announcements), ADIA, GIC, Mubadala, CPP Investment Board, China Investment Corporation, and Norges Bank Investment Management. Twelve national industrial policy programmes shape where sovereign capital can deploy and on what terms, with the US CHIPS Act, EU AI Act and DORA, and the various Middle East and Asia-Pacific programmes each reshaping the eligible investment universe on their own trajectories.
Structural characteristics
Sovereign capital tends toward longer duration, lower fee load, and more industrial-policy alignment than institutional PE. Deployment often runs through co-investment vehicles with established GPs (Blackstone, KKR, Brookfield) rather than direct sponsorship. That co-investment structure has scaled quickly, and the industrial-policy overlay has grown sharper as 2024-2026 CFIUS reviews and outbound investment rules tightened.
Framework calibrated on live deals
Three case studies apply the framework end-to-end on 2024-2026 transactions. Each includes per-layer scoring, the 2×2 verdict visual, and the assessment basis for public [P], derived [D], and illustrative [I] claims.
- AirTrunk / Blackstone + CPP (Sep 2024) — UNDERWRITE benchmark. Both scores LOW, veto GREEN. The clean-deal calibration anchor.
- CoreWeave $2.6bn DDTL 3.0 (Jul 2025) — AMBER worked example. Parent-guarantee absorbs an open tail that would fire the veto in a thin-equity SPV. Framework verdict: RESTRUCTURE with AMBER, not RED.
- Crusoe / Stargate Abilene — RESTRUCTURE, realized. Framework flagged single-tenant concentration pre-close; the failure mode materialised in Mar 2026 when Oracle + OpenAI dropped the expansion. Microsoft + Meta stepped in.
Related work
Pool 5. REIT and public-market vehicles
Publicly listed data centre operators (Digital Realty, Equinix, Iron Mountain) fund the balance of the AI infrastructure buildout through public-market equity issuance, senior unsecured debt, and green-bond programmes. This pool captures the incremental capital that neither hyperscalers nor sponsors want to hold on-balance-sheet.
Structural characteristics
REIT tax treatment shapes what these operators can hold and how they distribute cash. AI-specific capex requires structural workarounds (taxable REIT subsidiaries for equipment, specialised financing vehicles for behind-the-meter power) that add complexity relative to conventional colocation REITs. Public-market comparables have started to re-rate through 2025-2026 as the AI capacity build compresses free cash flow at some operators.
Framework calibrated on live deals
Three case studies apply the framework end-to-end on 2024-2026 transactions. Each includes per-layer scoring, the 2×2 verdict visual, and the assessment basis for public [P], derived [D], and illustrative [I] claims.
- AirTrunk / Blackstone + CPP (Sep 2024) — UNDERWRITE benchmark. Both scores LOW, veto GREEN. The clean-deal calibration anchor.
- CoreWeave $2.6bn DDTL 3.0 (Jul 2025) — AMBER worked example. Parent-guarantee absorbs an open tail that would fire the veto in a thin-equity SPV. Framework verdict: RESTRUCTURE with AMBER, not RED.
- Crusoe / Stargate Abilene — RESTRUCTURE, realized. Framework flagged single-tenant concentration pre-close; the failure mode materialised in Mar 2026 when Oracle + OpenAI dropped the expansion. Microsoft + Meta stepped in.
Related work
Pool 6. OEM balance sheet
Vertiv, Eaton, Delta Electronics and Schneider Electric self-finance the vendor buildout of components and modular systems that will be sold into hyperscaler contracts. This pool ranks behind the other five in most standard coverage but shapes the vendor economics that decide profit-pool distribution across the AI Power Chain. The OEM balance sheet has funded roughly $10-20B of capex expansion across these four vendors alone during 2023-2026 per company disclosures.
Structural characteristics
OEM capex tends to be under-modelled by sell-side coverage because it does not sit in any published aggregate AI infrastructure spend estimate. That under-modelling shows up as coverage-asymmetry mispricing on vendor equity, particularly at the wide-bandgap and thermal ends of the Power Chain where the capex intensity is highest.
Framework calibrated on live deals
Three case studies apply the framework end-to-end on 2024-2026 transactions. Each includes per-layer scoring, the 2×2 verdict visual, and the assessment basis for public [P], derived [D], and illustrative [I] claims.
- AirTrunk / Blackstone + CPP (Sep 2024) — UNDERWRITE benchmark. Both scores LOW, veto GREEN. The clean-deal calibration anchor.
- CoreWeave $2.6bn DDTL 3.0 (Jul 2025) — AMBER worked example. Parent-guarantee absorbs an open tail that would fire the veto in a thin-equity SPV. Framework verdict: RESTRUCTURE with AMBER, not RED.
- Crusoe / Stargate Abilene — RESTRUCTURE, realized. Framework flagged single-tenant concentration pre-close; the failure mode materialised in Mar 2026 when Oracle + OpenAI dropped the expansion. Microsoft + Meta stepped in.
Related work
The five PE playbooks
Sponsor deployment across the six AI Power Chain layers has followed five identifiable playbooks. Return profile, hold period and exit path all vary meaningfully across the five.
Playbook 1: Developer-layer buyouts. Blackstone/QTS, KKR + GIP/CyrusOne, Blackstone + CPP/AirTrunk. Sponsor purchases a data centre developer with a pre-existing hyperscaler contract pipeline. Underwriting is priced against contracted MW revenue growth. Target IRR in the mid-teens on 5-7 year hold. Exit to public markets, strategic buyer, or infrastructure fund.
Playbook 2: Vendor consolidation. Advent/Ultra PCS, Bain/Proterial power business, Cinven's specialty semi rollups. Sponsor rolls up capability-adjacent industrial technology vendors serving AI infrastructure without direct data centre ownership. Underwriting is priced against industrial-technology exit multiples. Target IRR in the high-teens to mid-twenties on 4-6 year hold. Exit to strategic buyer or IPO.
Playbook 3: Specialist GPU cloud sponsorship. Fidelity, Magnetar and various sovereign co-invests into CoreWeave, Nscale, Crusoe, Lambda and Nebius. Sponsor takes minority growth equity alongside DDTL structures backed by hyperscaler contracts. Return profile blends growth-equity upside with structured-credit downside protection.
Playbook 4: Behind-the-meter power. Specialist sponsors (Fervo, Kairos-adjacent capital, nuclear restart sponsors) fund generation assets pledged to hyperscaler PPAs. Long-dated cash flows, infrastructure-fund IRRs, and specific regulatory + siting risk that sits outside the classical AI infrastructure investing lens.
Playbook 5: Adjacent industrial technology. Sponsors positioning in supply-chain adjacencies (industrial gases, specialty chemistry, high-voltage cable, transformer core steel) that scale with AI infrastructure demand without direct AI exposure. Underwriting priced against industrial technology comparables. Return profile depends heavily on the specific sub-sector.
Beyond the five playbook shapes, three specific platform theses are being constructed by named sponsors across the 2024-2026 window, each combining multiple playbooks into a single strategic bet. The PE playbook essay names each thesis and the sponsors executing it.
The four M&A through-lines
Vendor M&A activity across 2023-2026 has clustered around four analytical patterns. Each pattern describes a specific strategic logic and a specific investible signal.
Through-line 1: Strategic-buyer thermal consolidation. Eaton acquired Boyd Thermal for approximately $9.5B (closed March 2026 per company disclosures). Ecolab acquired CoolIT from KKR for approximately $4.75B (closed 2 July 2026). Schneider Electric acquired a 75% controlling interest in Motivair for $850M (closed 28 February 2025), with the remaining 25% subject to a 2028 put/call arrangement. Vertiv built cooling capability through tuck-in acquisitions including Strategic Thermal Labs and PurgeRite. Strategic buyers are pricing thermal capacity as a scarce strategic input to hyperscaler capacity, not as a services line item.
Through-line 2: Wide-bandgap semiconductor consolidation. Infineon acquired GaN Systems in October 2023 for approximately US$830M per Infineon disclosures. Wolfspeed emerged from Chapter 11 restructuring in September 2026 and remains an open positioning question in the merchant SiC market. ST, onsemi and ROHM continue as merchant SiC MOSFET suppliers. The pattern is toward consolidation at the merchant vendor layer as hyperscaler qualification cycles favour incumbents with decades of field-hours data.
Through-line 3: Developer-layer take-privates. Blackstone/QTS (approximately US$10B, 2021), KKR + GIP/CyrusOne (approximately US$15B, 2022), Blackstone + CPP/AirTrunk (approximately US$16B, September 2024, per company disclosures). Colocation and hyperscale developer take-privates by infrastructure and PE sponsors, priced against long-dated hyperscaler-contracted revenue.
Through-line 4: Nuclear + generation asset PPAs. Microsoft + Constellation on Three Mile Island Unit 1 (2028 target). Amazon + Talen on Susquehanna. Google + Kairos Power (500 MW SMR programme with mid-2030s target; the concrete first anchor is Google-Kairos-TVA 50 MW Hermes 2 SMR announced 18 August 2025). The M&A activity here is asset-level PPA structuring rather than traditional acquisition, but it reshapes the generation-side capital pool available to hyperscalers on a specific timeline.
Fifteen forward M&A candidates by name are tracked in The AI infrastructure M&A map.
The three downside cases
Three distinct scenarios stress the AI infrastructure investment thesis at portfolio level. Each has a different transmission mechanism, a different asset exposure, and a different set of signals to watch.
Downside 1: Demand-side shock. AI monetisation lags AI capex, which compresses hyperscaler demand for third-party capacity through renegotiation of colocation contracts and re-timing of hyperscaler build pipelines. Direct exposure concentrates at Pool 1 (hyperscaler capex itself) and at Pool 5 (public REIT operators contracting to hyperscalers). Hyperscaler capex guidance, GPU pricing at the specialist GPU cloud operators, and any capacity-flex clauses being executed all provide early warning.
Downside 2: Grid + generation supply shock. This case works differently. Interconnection queue reform accelerates, transformer supply catches up, and the scarcity premium currently priced into contracted MW compresses at renewal. Pool 3 sponsor equity underwritten against that scarcity-driven pricing takes the hardest hit, and Pool 5 REIT operators depending on renewal price increases follow. FERC Order 2023 implementation cadence, transformer OEM order-book updates, and material changes in average interconnection queue timing all give early warning.
Downside 3: Vendor consolidation over-pricing. Strategic buyers over-pay at the current thermal, wide-bandgap and modular M&A window. Goodwill write-downs follow later as the qualified-supplier scarcity thesis evolves. The exposure here does not show up in operator distress but in Pool 6 OEM balance sheets and in listed strategic buyers such as Eaton, Ecolab and Schneider that anchored the recent transactions. Watch for acquirer-side deal disclosures, integration milestones, and any early impairment tests as the leading indicators.
The uncontracted-principal veto
The framework's signature analytical move sits at the intersection of financing structure and repayment source. The veto asks a specific question at debt maturity: what share of outstanding principal is repaid from cash flows already contracted today, versus from assumed re-leasing, refinancing, residual value, or contract renewal not contracted today. And is the economic repayment exposure for that uncontracted share absorbed by one of the standard mechanisms (rated corporate-parent recourse, cross-collateralization to material operating assets, required equity cure, committed backup refinancing facility), or absent.
The veto is a two-by-two, not a flat rule. RED fires only when both legs are high: over 40% uncontracted principal (measured against nominal principal not covered by contracted cash-flow NPV plus committed takeout facilities) AND economic repayment exposure absent (borrower unrated, no parent guarantee, no cross-collateralization, no required equity cure, no committed backup facility). AMBER is either leg high with the other absorbed. GREEN is both low. Threshold band: scores within 5 percentage points of the 40% line trigger a manual-review flag rather than the automatic verdict.
CoreWeave's DDTL evolution demonstrates the framing directly. DDTL 3.0 was parent-guaranteed and secured by subsidiary assets; the parent-recourse leg absorbed the uncontracted-principal exposure. DDTL 4.0 is non-recourse except for customary carve-outs but explicitly supports previously-contracted cloud services; the contracted leg absorbs. Both structures score AMBER on the framework's veto, not RED, because one leg is absorbed in each. The mismatch alone does not fire the veto; the wired combination does.
The build-to-lease flip
One structural pattern deserves separate treatment because it has reshaped hyperscaler asset ownership over the past seven years. Hyperscaler-owned data centre capacity as a share of new-build MW additions has fallen from majority-owned in 2018 to majority-leased by 2025. Amazon's Northern Virginia owned campus additions of 2018-2020 have no directly comparable equivalent in 2024-2026, where the same demand is served through Digital Realty, QTS, Vantage and Compass leased capacity.
The flip is driven by three factors that reinforce each other. First, hyperscaler capex discipline pushes owned-vs-leased toward leased at the incremental margin. Second, the developer-layer sponsor market has grown to absorb the demand, priced against long-dated hyperscaler-contracted revenue. Third, the ownership decision at greenfield sites now interacts with grid interconnection queue positioning in ways that favour developers holding queue slots ahead of hyperscaler counterparties.
The return arithmetic breaks down predictably when interconnection queue reform arrives and transformer scarcity resolves. That is why Downside 2 above weights so heavily on Pool 3 and Pool 5.
What the framework tells you
The Investment Layer framework produces three analytical claims that the individual essays develop in depth.
First, capital allocation concentration by pool diverges sharply from headline coverage. Pool 1 (hyperscaler self-funding) captures the majority of dollars but the least sell-side attention. Pool 2 (DDTL) captures disproportionate mainstream coverage relative to committed scale. Pool 6 (OEM balance sheet) captures almost no coverage despite meaningfully shaping vendor equity performance.
Second, return profile varies sharply by playbook, and the sponsor-side risk-return profile does not always match the LP-side reporting. Developer-layer buyouts (Playbook 1) with lease-back exposure to the same hyperscaler counterparties carry correlated downside that fund-level diversification does not resolve. Vendor consolidation (Playbook 2) carries the highest IRR potential but also the highest execution risk when integration proves harder than the underwriting priced.
Third, the downside cases share a common signal set that operators, sponsors and LPs should monitor collectively. Hyperscaler capex guidance, FERC Order 2023 implementation cadence, transformer OEM lead-time updates, and vendor-side integration milestones all sit in the shared signal set. Monitoring these signals in isolation misses the correlation across downside cases.
What the framework does not do
The framework decomposes the capital allocation and value-capture pattern. It does not substitute for asset-level modelling. Individual deal underwriting requires the specific covenant, cost, and counterparty analysis that the Due Diligence framework covers separately.
The framework does not cover the demand-side capacity procurement decisions that drive hyperscaler capex intensity, or the software layer above the accelerator that shapes model economics. Those sit in adjacent analytical frameworks that overlap with the Investment Layer at the demand-side signal set but require separate machinery.
The framework snapshots the capital allocation pattern as of 2026. It will need to be updated as new capital pools scale (behind-the-meter generation vehicles, specialised training-capacity vehicles), as new playbooks emerge, and as the downside cases evolve with the underlying market.
Where the framework has been applied
The framework structures the analytical content across the eight Investment Layer essays and connects to adjacent series. The Financing the AI Buildout series covers each capital structure in the six pools individually. The Case Studies series applies the framework to specific transactions across 2023-2026. The Due Diligence for the AI Buildout series operationalises the framework across sixteen commercial and technical DD workstreams.
Operational instrumentation ships alongside the framework. The two Investment Layer tools (the 15-minute scorecard and the 35-minute workbench, published August 2026) instantiate the framework's decision logic directly in the browser. A downloadable technical DD workbook packages the paid tier: dollarised sensitivity model, jurisdiction-tagged covenant language templates, three-tier provenance calibration bands per playbook (evidence-backed, methodology-sourced, analytical calibration), and Project Atlas illustrative composite. Atlas is a deterministic reconstruction (sources equal uses forced, DSCR computed as EBITDA over interest, open-tail computed) that demonstrates the amber-versus-red distinction on identical numbers with different recourse structures.
Framework evolution
Three open questions currently shape how the framework will evolve through 2027-2028.
First, the Pool 2 (DDTL) rating framework question resolves as S&P, Moody's and Fitch converge on a shared methodology for hyperscaler-contract-collateralised debt. Rating convergence will compress the spread dispersion currently visible across the same collateral pool and change the relative attractiveness of the pool for both LP-side capital and refinance activity.
Second, the Pool 4 (sovereign capital) trajectory depends on how the industrial-policy overlay evolves. CFIUS review scope expansion, outbound investment rules, and the CHIPS Act successor programmes will each reshape which sovereign pools can deploy where. The framework will need to track those policy trajectories more carefully than a pure capital-structure lens currently does.
Third, the OEM balance-sheet pool (Pool 6) is under-recognised in current sell-side coverage but shapes vendor equity performance meaningfully. As integration outcomes from the 2023-2026 M&A window become visible (Eaton/Boyd, Ecolab/CoolIT, Infineon/GaN Systems, Vertiv tuck-ins), the framework will need to track goodwill and integration signals as first-order inputs rather than as second-order coverage.
Fourth, the operational architecture continues to sharpen through the tools. Version 2.3.2 (August 2026) codified the two-by-two veto structure with CoreWeave DDTL 3.0 (SOFR+400, parent-guaranteed, unrated) as amber calibration example, true conditional rendering on instrument-specific mechanics per capital-stack composition, three-tier provenance labelling on all calibration bands, and a monitoring dashboard tiered as 5 primary plus 5 secondary plus up to 4 sponsor-specific signals. The v2.3.2 patch also corrected the DDTL pricing anchor across tools after cross-referencing the primary SEC filing (crwv-20250728). Further architectural iteration should await feedback from live diligence deployment rather than continued theoretical review.
Essays applying the Investment Layer framework
The Investment Layer series decomposes capital pools, sponsor playbooks, M&A through-lines and downside cases across AI infrastructure. The essays below build and apply the framework.
- 1/8How the AI buildout is financed
- 2/8The AI infrastructure M&A map
- 3/8The build-to-lease flip
- 4/8The coverage asymmetry
- 5/8The PE playbook, stage by stage
- 6/8Underwriting AI infrastructure debt
- 7/8The three downside cases
- 8/8Sovereign capital and industrial policy
- Flexibility Right · Probabilistic Underwriting Model (Monte Carlo across four macro scenarios; project-finance waterfall, correlated inputs, per-ISO bankability)