
Direct-to-chip capex, opex + TCO calculator
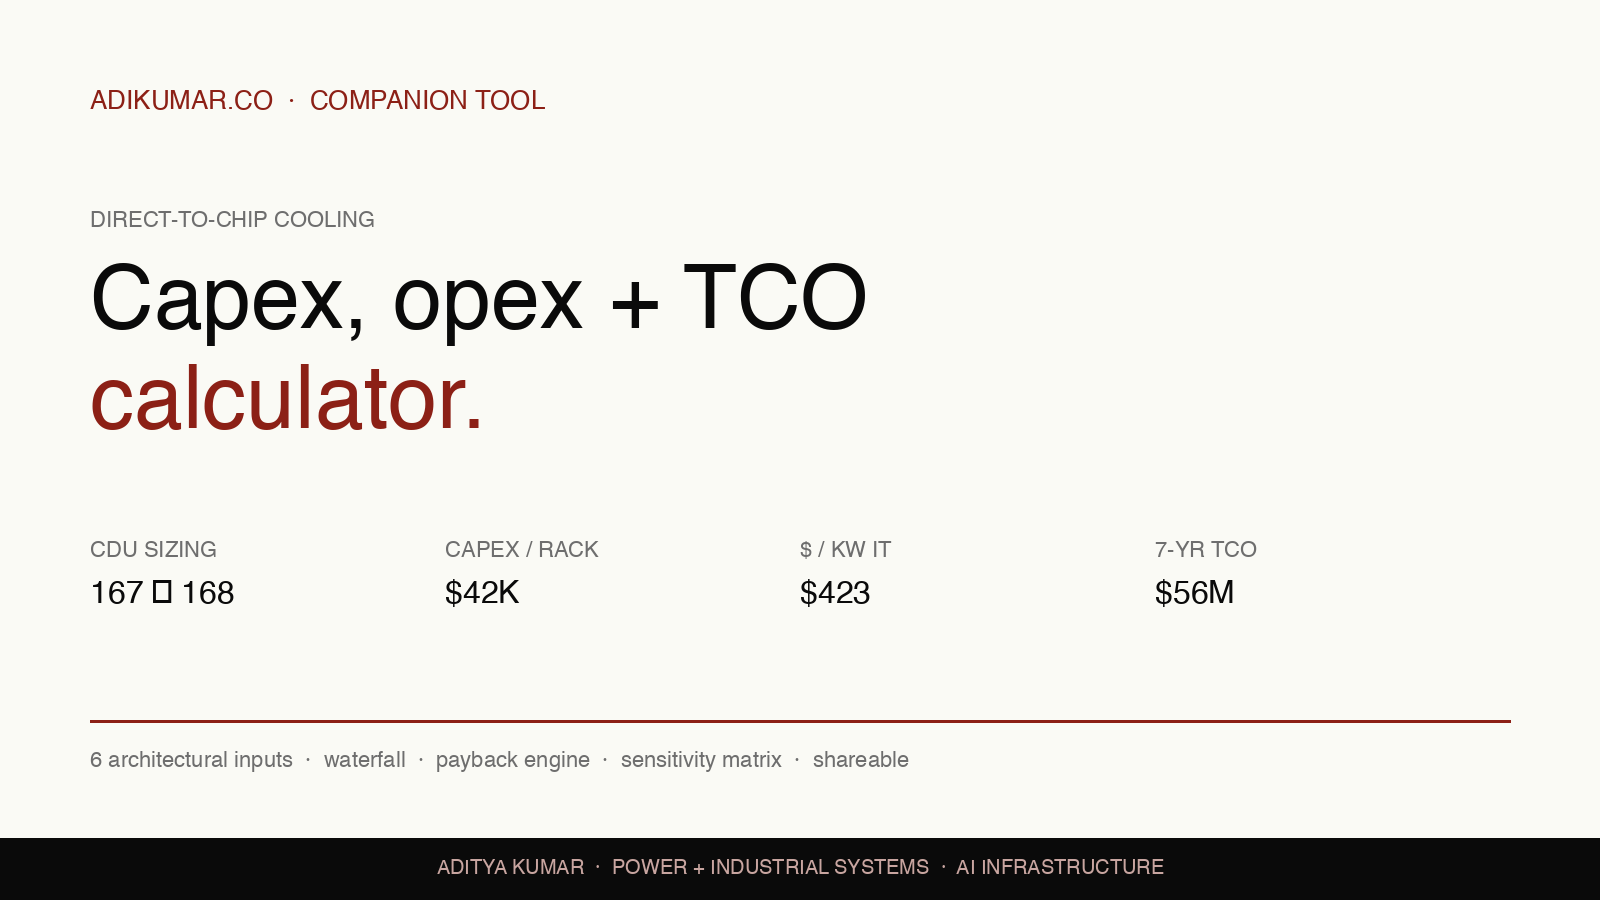
Author-built engineering scenario model. CDU sizing, per-rack and campus capex, annual opex, and 7-year TCO derived from six architectural inputs. Fig C15 anchors and free-cooling scenario detail below.
Inputs
Architecture
Operating economy
Advanced · capex and opex overrides
Capex composition · per rack + campus aggregate
| Slice | $/rack | Aggregate | % baseline |
|---|---|---|---|
| Cold-plate + TIM | $5.0K | $2.50M | 11% |
| Manifold | $3.0K | $1.50M | 7% |
| QDs | $1.0K | $0.50M | 2% |
| CDU share (base) | $8.0K | $4.00M | 18% |
| Controls + leak | $3.0K | $1.50M | 7% |
| Facility loop + rejection | $12.0K | $6.00M | 27% |
| Air trim | $4.0K | $2.00M | 9% |
| Install + commissioning | $8.0K | $4.00M | 18% |
| Baseline anchor · Fig C15 · @ 100 kW | $44.0K | $22.00M | 100% |
| tsup adjustment · 45 °C, −15% facility slice | −$1.8K | −$0.90M | |
| CDU redundancy uplift · N+1 spare | +$0.05K | +$0.02M | |
| Adjusted scenario total | $42.3K | $21.13M |
Capex waterfall · anchor → adjustments → scenario total
Model boundary · technology-side vs facility-side
Annual operating costOpex · year 1 breakdown
Opex composition · year 1
| Line | $/rack/yr | Campus/yr | % total |
|---|---|---|---|
| Facility electricity (IT × (PUE − 1) × util × 8760 × $/kWh; includes pump + fans + chillers) | $8.4K | $4.20M | 84% |
| of which pump electricity (pump fraction × IT × util × 8760 × $/kWh; two-phase: 0.6×) | $0.8K | $0.42M | sub |
| of which non-pump overhead (chillers, fans, controls, facility) | $7.6K | $3.78M | sub |
| Preventive maintenance (% capex / yr) | $1.5K | $0.74M | 15% |
| Coolant chemistry + refresh (% of coolant capex / yr) | $0.1K | $0.05M | 1% |
| Water (evaporative rejection only, tsup<40°C) | $0 | $0.00M | 0% |
| Total opex / year | $10.0K | $4.99M | 100% |
Full lifecycleTotal cost of ownership
TCO growth · capex + cumulative opex over horizon
Payback engine · architectural switch economics
Free cooling · 45 °C vs 32 °C tsup
Two-phase premium · single vs two-phase
Sensitivity matrix · year-1 opex under different power price × utilisation
| Electricity \ IT util. | 50% inference | 75% mixed | 90% training-heavy |
|---|---|---|---|
| $0.06 / kWh bulk US | $3.2M | $4.2M | $4.8M |
| $0.10 / kWh EU / industrial | $4.4M | $5.8M | $6.7M |
| $0.14 / kWh peak / constrained | $5.6M | $7.4M | $8.5M |
Density transition · same rack count, redundancy, coolant temperature and unit costs
Capex · anchor points and interpolation
Three anchor stacks from Fig C15 of the parent essay drive the capex model:
40 kW  → $14K/rack (air 8, facility 6)
100 kW → $44K/rack (air 4, cold-plate 5, manifold 3, QD 1, CDU 8, facility 12, controls 3, install 8)
250 kW → $87K/rack (air 7, cold-plate 12, manifold 5, QD 2, CDU 18, facility 22, controls 6, install 15)
Each capex slice interpolates linearly between adjacent anchor stacks: 40→100 uses the 40 and 100 stacks, 100→250 uses the 100 and 250 stacks. Total-per-rack is the sum, so it stays consistent with the three published anchor totals. Above 250 kW the 100→250 slope continues; treat that regime as directional.
Capex adjustments
Coolant supply temperature. 45 °C removes 15% from the facility-loop slice (dry-cooler free cooling). 32 °C adds 20% (chiller required). Linear between. The adjustment appears as a separate row in the composition table so the arithmetic reconciles with the essay anchor visibly.
Two-phase multiplier. 1.35× applied to cold-plate + TIM, CDU share and controls when two-phase is selected. The model treats two-phase as economically relevant above ~180 kW/rack and disables the toggle below that; the 180 kW threshold is a model assumption, not an industry-standard boundary.
Redundancy. Base CDU count = ceil(total IT load / CDU capacity per unit). N leaves it as the base count. N+1 adds one hall-level spare CDU. 2N doubles the count. CDU capex scales with the number of installed CDUs, so N+1 adds one CDU's worth of capex and 2N doubles the CDU capex slice — redundancy is not just a spare on the shelf, it is fully-installed capacity. Real deployments may apply N+1 by row, zone or CDU group; this model uses the simpler hall-level abstraction.
Opex · formulas
Effective PUE      = base PUE − (pump_fraction_1p × 0.40)   when two-phase is selected
                   = base PUE                                   otherwise
   (two-phase drops pump electricity to 0.6× the single-phase level; that saving
    lowers effective PUE so total facility electricity falls accordingly)
Facility electricity = IT_MW × (effPUE − 1) × utilisation × 8760 × $/kWh × 1000
   (this is the ONLY electricity line; PUE is treated as inclusive of pumps + fans + chillers)
Pump electricity    = pump_fraction × IT_MW × utilisation × 8760 × $/kWh × 1000
   (sub-component of facility electricity; two-phase applies 0.6× to pump_fraction)
Non-pump overhead   = Facility electricity − Pump electricity
   (chillers, fans, controls, facility infrastructure)
Preventive maint.   = maint_pct × capex_total
Coolant refresh     = refresh_pct × 0.03 × capex_total
   (0.03 = coolant slice as fraction of stack; author estimate)
Water               = tsup < 40 ? IT_MW × 0.012 × 8760 × water_price : 0
   (0.012 m³/MWh IT is a typical evaporative rate)
Total opex          = Facility electricity + Maintenance + Coolant refresh + Water
   (pump is a sub-component of facility electricity, NOT added again on top)
Boundaries and caveats
Thermal load ≈ IT load. A simplified steady-state approximation. Pumps, fans, chiller consumption at low tsup are captured through PUE, not modelled separately.
CDU classification. Technology-side vs facility-side is a modelling choice. Other reasonable classifications put CDU on the facility-side (interface component owned by the facility MEP contractor). Treat the 48/52 split as one lens.
Two-phase vs immersion. Two-phase DTC and immersion are architecturally distinct above ~250 kW/rack, not variations of one architecture. The two-phase toggle here only sits inside DTC; immersion is out of scope.
Not modelled. Flow-rate + delta-T at the cold plate. Coolant fluid choice (water-glycol vs dielectric). White-space floor loading. Dual-loop A/B redundancy for tier-4 workloads. Component lead-time sensitivity. Any of these can move the numbers materially; treat this tool as a first-pass scenario framework, not a mechanical/electrical design study.
Change any anchor unit cost or opex assumption in Advanced to reflect a hyperscaler-specific reference design, negotiated CDU pricing, site energy price or a specific climate. See Data Centre Cooling · a double-click on Direct-to-Chip for the underlying architecture, vendor scorecards and value-migration analysis.
Data Centre Cooling · a double-click on Direct-to-Chip
The nine-layer DTC stack, capex composition, three-architecture comparison, consolidation race and investor decision map. Source of the Fig C15 anchor points this calculator interpolates between.
Leak-detection coverage calculator
Companion tool covering the operational layer that decides whether a DTC deployment is insurable at hyperscale. Coverage tiers, sensor mix, cable topology and $/kW IT arithmetic on a reference 100 MW campus.